VOTE mARch 10 IN THE CLAREMONT SCHOOL ELECTIONS. fOR THE FIRST TIME, CLAREMONT CITIZENS--NOT INSIDERS--CAN LIMIT OUT-OF-CONTROL SPENDING.
Preparing for the Spring fleecing
By Kevin Tyson
1/6/2026
SAU 6 built the FY27 budget and has published a “Budget Presentation” plus operating budgets for the 3-school and 4-school configurations. Unfortunately, the district continues to publish core financial information only as PDFs. SAU 6
PDFs are fine for printing. They are terrible for analysis. When public budgeting is distributed in a format that cannot be cleanly filtered, summed, or compared without manual re-entry, it predictably blocks taxpayer review. Whether that outcome is intentional or merely habitual, personally, (I suspect the former), the effect is the same: it raises the cost of oversight and lowers the odds that anyone catches bad assumptions early. After all, that’s how they created our current deficit crisis.
So we did the obvious thing: we converted the PDFs into spreadsheets and compared the two models line by line.istributed in a format that cannot be cleanly filtered, summed, or compared without manual re-entry, it predictably blocks taxpayer review. Whether that outcome is intentional or merely habitual, personally, (I suspect the former), the effect is the same: it raises the cost of oversight and lowers the odds that anyone catches bad assumptions early. After all, that’s how they created our current deficit crisis.
So we did the obvious thing: we converted the PDFs into spreadsheets and compared the two models line by line.


Guest Blogger: The School Budget Is Public, But the Data Still Isn’t
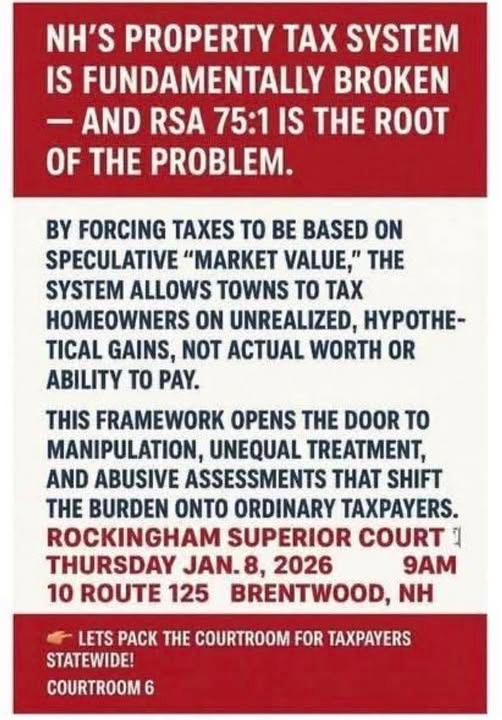
Guest Blogger: New Hampshire’s property-tax game has turned into legalized home seizure — and RSA 75:1 is the rulebook they’re using to do it.
By Francis Gauthier
12/11/2025
⸻
How “market value” becomes a weapon
RSA 75:1 tells towns to tax property based on “full and true value” — which assessors and consultants now translate as speculative “market value.”
That sounds technical, but here’s what it means in real life:
• Your town looks at what the hottest house on your street just sold for
• They decide your home — even if it’s 50 years old, paid off, and on a fixed-income owner — is suddenly “worth” that much too.
• They raise your assessment to match the new “market,” and your tax bill jumps hundreds or thousands of dollars a year… even though your income hasn’t gone up by a single penny.
New DOE Numbers Show Enrollment Falling, Spending Rising in NH Schools
by Michael Graham
(11/17/2025)
The main points:
'“Per-pupil estimated state adequacy is at an all-time high with an average of $7,132 — a more than 30 percent increase over the last 10 years,” the report states. “The state will also invest a record $49.9 million in special education — a more than 130 percent increase from 10 years ago.”
Despite repeated Democratic assertions that Republicans are slashing education funding or “downshifting” costs to local districts, state spending on K–12 schools has increased every year a Republican governor has been in office, dating back to Chris Sununu’s election in 2016.
“The state average grant per pupil is approximately $7,100, with Claremont slated to receive an estimated $13,443 per pupil."
The “Nation’s Report Card” Is Out
(5/12/2025)
A report by the Manhattan Institute analyzes the 2024 National Assessment of Educational Progress (NAEP) results, known as the “Nation’s Report Card.” The report highlights a long-term crisis in U.S. education, with student performance in reading and math stagnating or declining despite decades of federal spending and reform initiatives.
Key findings include:
Reading proficiency for fourth- and eighth-graders has remained near 30%–31% since the early 1990s, with scores in 2024 regressing to early 2000s levels—down from a peak of 35% (fourth grade) and 36% (eighth grade) in 2013.
Math proficiency peaked in 2013 at 42% (fourth grade) and 35% (eighth grade), but has since declined to 39% and 28%, respectively, in 2024.
Public school performance improved under the No Child Left Behind (NCLB) Act (2003–2013), stagnated after Common Core implementation, and declined further under the Every Student Succeeds Act (ESSA), which weakened accountability.
Urban districts like New York City, Chicago, and Los Angeles show persistently low proficiency rates—e.g., NYC’s fourth-grade reading proficiency at 28%.
Charter schools demonstrated greater stability across performance levels compared to public schools, especially among low- and average-performing students.
States with collective bargaining laws for educators saw steeper declines in reading and math scores, suggesting less flexibility in instructional adaptation.
Despite record per-pupil spending—exceeding $17,000 in some states—student achievement has not improved, indicating that funding alone does not drive success.
Stay Updated
Get iClaremont news alerts delivered straight to your email box.
Contact us at info@iclaremont.com
© 2026. All rights reserved.